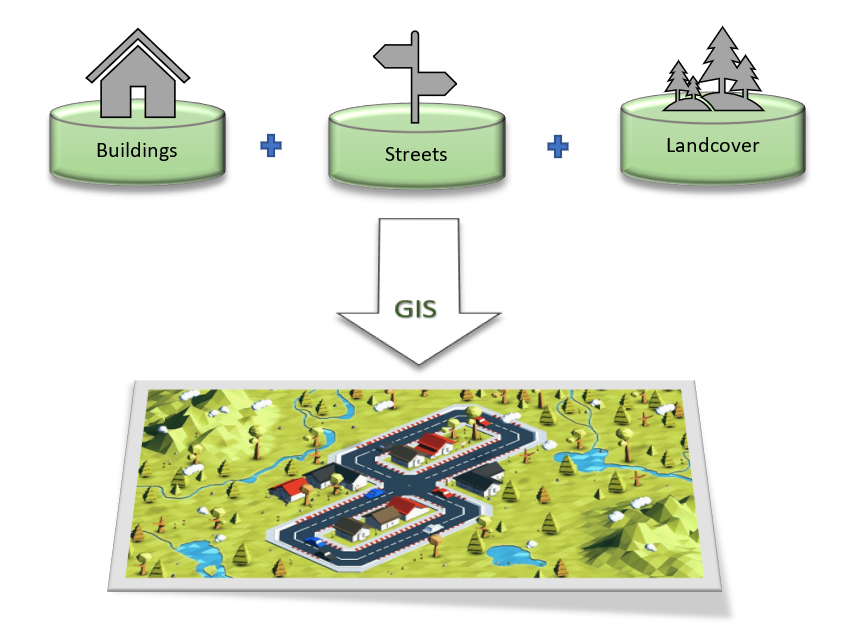
The term “Geographic Information System” (GIS) stands for a digital concept, a software or web-based solution as well as certain type of projects for capturing, storing, checking, analyzing and displaying data (which are popularly termed as geospatial data or geodata) related to their positions on Earth’s surface. A GIS project can be compared to a huge stack of digital maps that are piled on top of each other and analyzed with the help of geographic coordinates. Instead of comparing and analyzing maps or geodata side-by-side, in a GIS project two or more different data types included as “GIS layers” can be examined easily by overlaying, adjusting transparency and using spatial processing techniques that may include simple or complex calculations.
Each GIS layer contains information about a certain object type, such as administrative boundaries, buildings, vegetation, temperature, elevation etc… Spatial information could be an address, coordinates containing latitude and longitude or complex three-dimensional geometry. GIS data can be represented in Vector or Raster formats and can be effectively used to map spatial relationships and change. The geometrical information about an object is represented as points, lines or polygons or as a grid (similar to a digital image), and the associated information like values, names and descriptions are stored in connected databases, tables or files. This enables people to see, analyze, and understand patterns, clusters and relationships with better understanding and ease.(1)
In general, any type of information that comes with a distinct location can be compared and contrasted using a GIS application. For example, we could use GIS to learn about the number of inhabitants in an area, their income, or their education level. When dealing with landscape, GIS layers may represent the location of water bodies, different kinds of forest, various soil types etc… Quite similar to traditional topographic maps, layers might also show sites of factories, farms and schools, or storm drains, roads, and electric power lines. GIS analysts also work with aerial photographs and satellite images for geospatial data analysis. GIS systems contribute globally to key areas like Urban planning, Environmental Impact Analysis, Navigation, Agricultural Applications and Disaster Management.