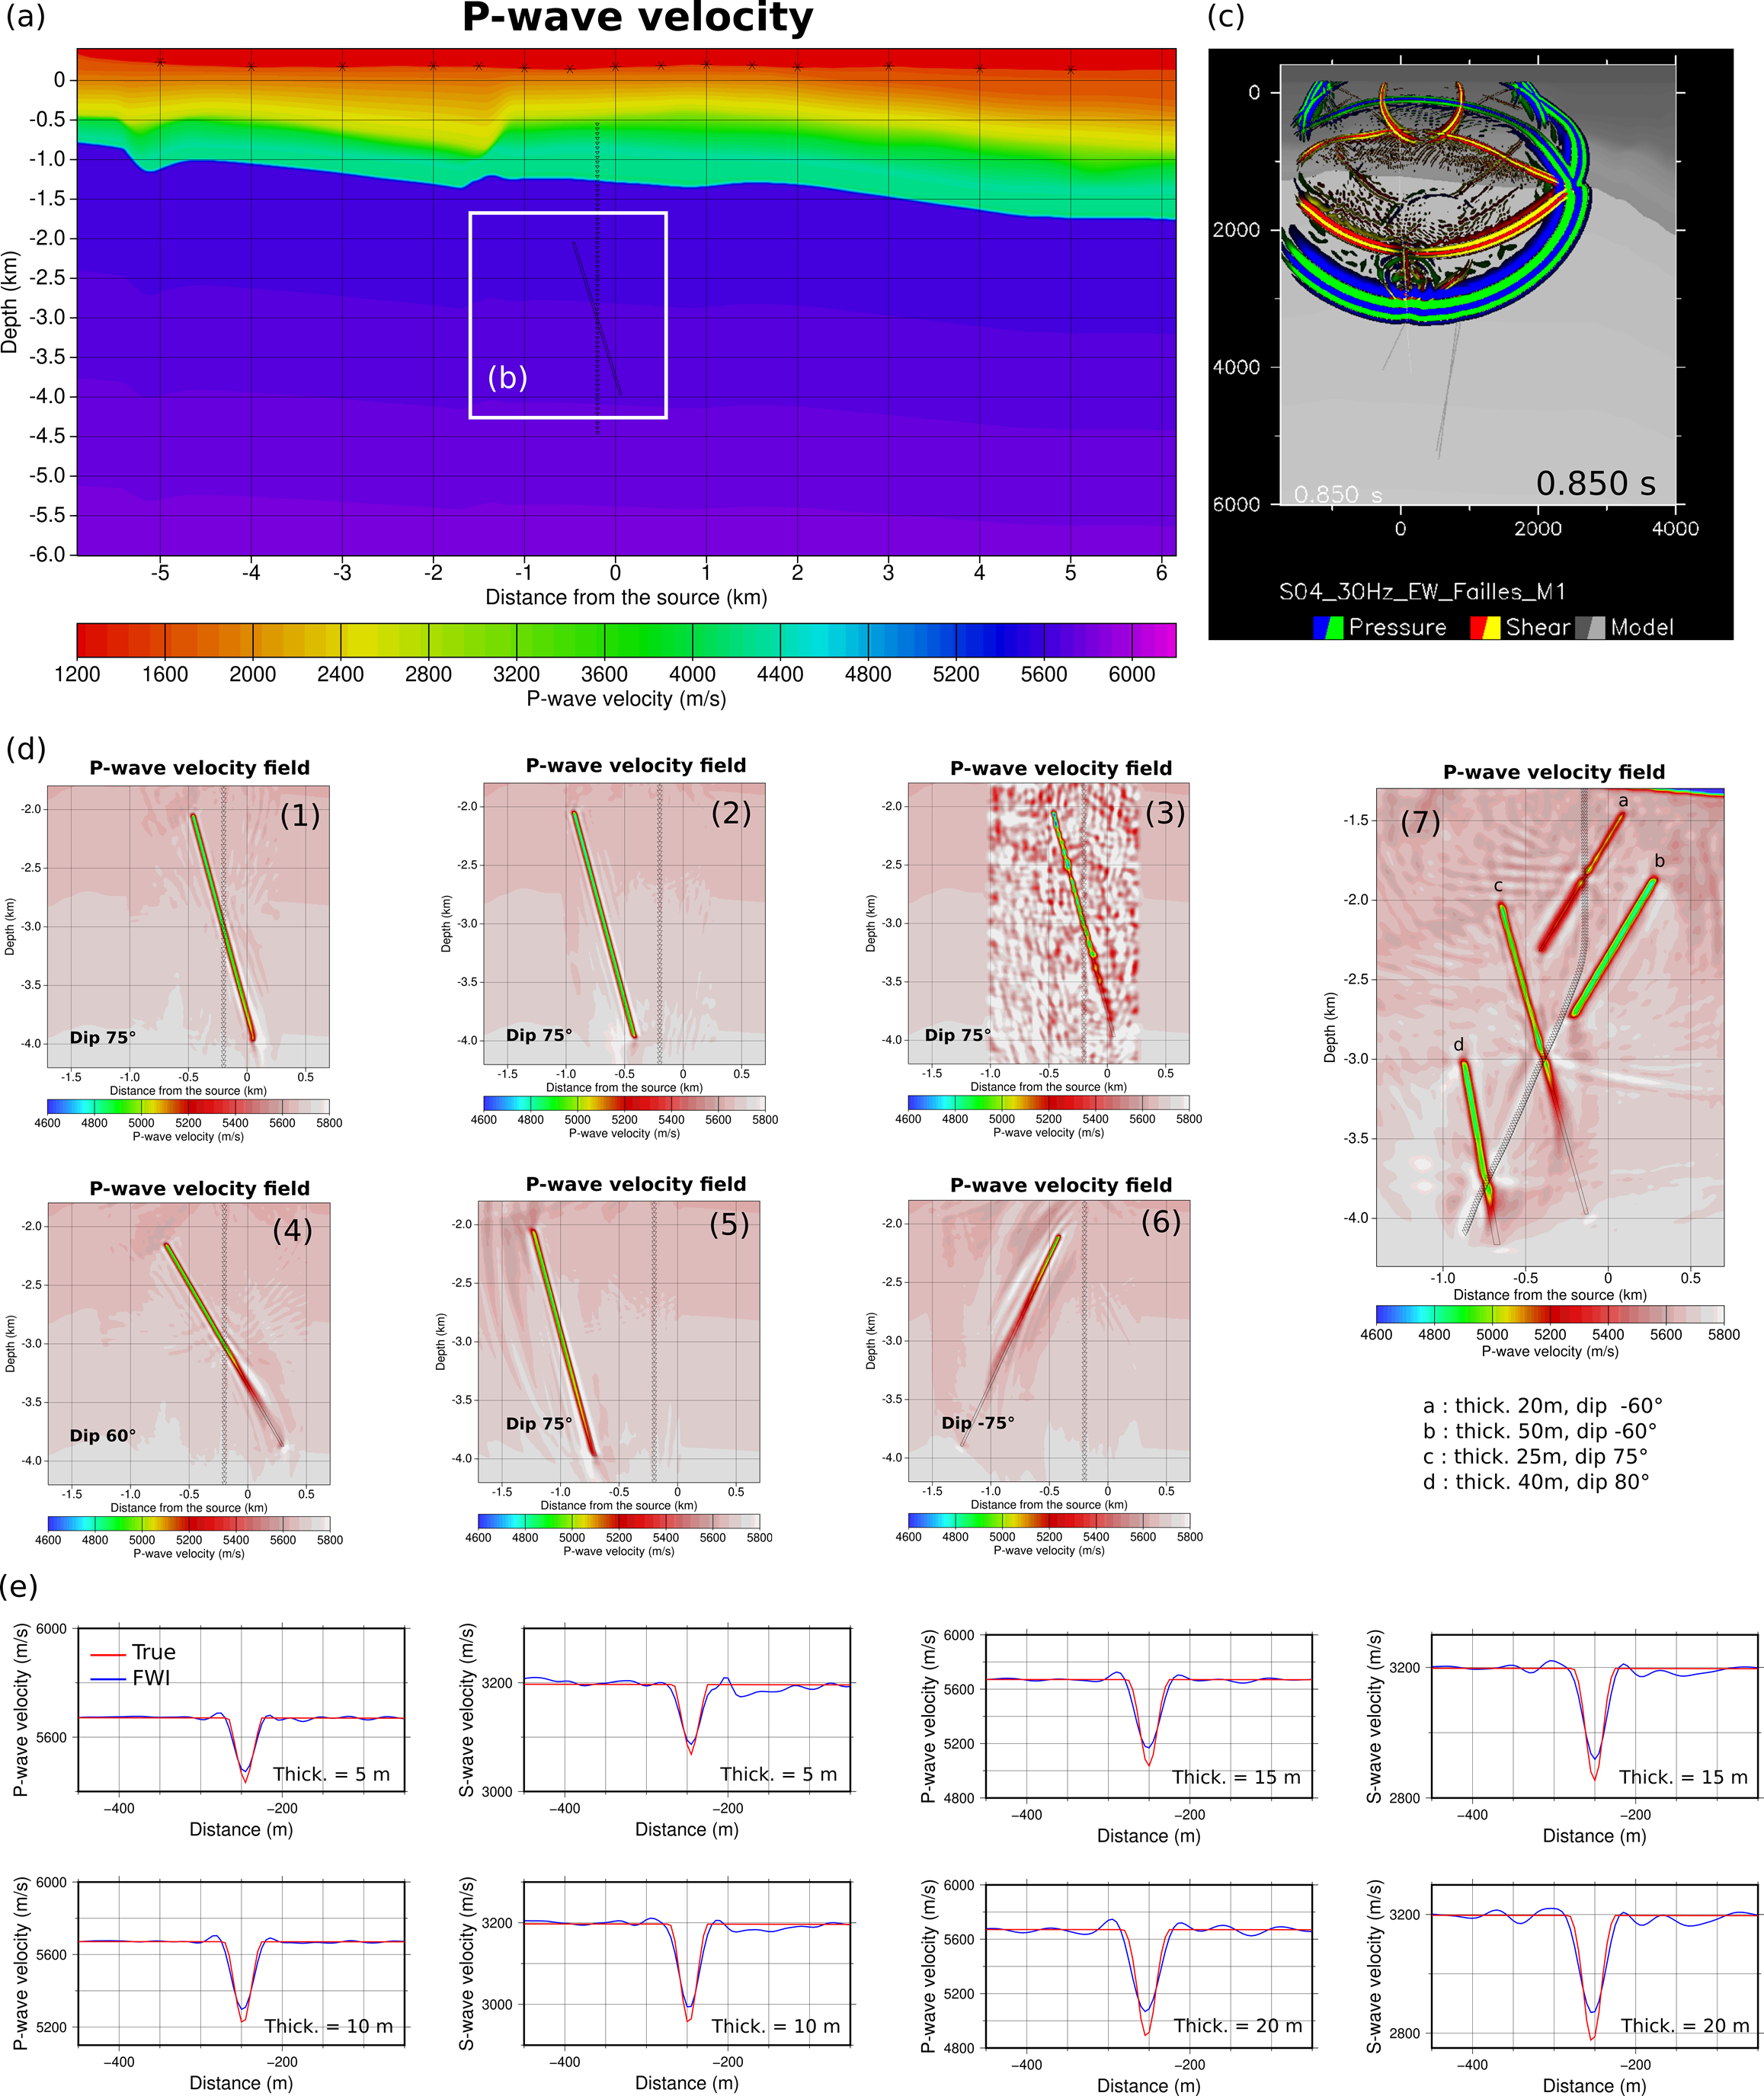
GIM-labs have performed a complete sensitivity study to assess the ability of the Full Wave Inversion (FWI) method to detect, delineate and further characterize faults in the granitic geothermal reservoir of Soultz-sous-Forêts. The objective of this study is to study the potential of the FWI applied to the crystalline rocks of Soultz. Their approach consists in performing synthetic FWI experiments and in comparing the estimated fields provided by the inversion; i.e the estimated underground images, to the initial reference model containing the fault target. They first tuned the inversion algorithmic parameters in order to adapt the FWI software originally dedicated to sedimentary context (generally used in O&G) to granitic context of Soultz-sous-Forêts. They studied also the sensitivity of the FWI fault imaging results as a function of the acquisition geometry parameters, and we suggest an optimal acquisition geometry (Figure 1). GIM-Labs have studied the effect of i) the number of shots, ii) the inter-shots distance and iii) the maximum offset, which could be used to improve the final FWI results. In these sensitivity studies, they have shown that:
- Using a single shot in the granite is more challenging for the FWI to characterize accurately the fault. The presence of important artefacts in estimated fields does not facilitate the interpretation of the fault images and leads to interpretation ambiguities. As expected, these artefacts are attenuated when increasing the shot numbers.
- Using 3 shots increase the quality of the retrieved images compared to the single shot but estimated fields remain perturbed by artefacts. 5 shots provide better estimated fields and from 7 shots and up, we retrieve accurately the fault with negligible artefacts. These conclusions have to be adapted for 3D domain.
- For a given number of shots, small inter-shot spacing, for instance 250 m, but also large inter-shot spacing as 1000 m does not give a suitable result. A reasonable intershot distance should be defined according to the depth of the target and to the seismic main frequency. Moreover, shots at far offset (once to twice the target depth) provide constraining information for the FWI, but for noisy data from field, far offset data quality is often not sufficient. These acquisition geometry parameters depend on the S/N ratio. These conclusions have to be adapted for 3D domain.
Considering the fault delineation and characterization goals, we mainly studied the effect of the fault thickness and its dip in both configurations: fault crossing the receivers or far away from the well.
- The obtained spatial resolution is good even for very narrow fault of 5 m thick, where about 98% of the physical parameter contrasts have been recovered. This result stands for noise-free data but, as the energy of the scattered field decrease with the fault thickness, for noisy data, the S/N ratio is critical for thin fault zones.
- We can accurately detect, delineate, and characterize faults showing high dip, for instance dip from 60 to 90°, which is the most representative faults dip which can cross at any continental deep geothermal.
- The multi-faults case was also studied and the FWI showed a noticeable robustness and ability for delineation and characterization objectives. The delineation and characterization of a fault network could be considered in future applications.
In summary and after achieving this sensitivity analysis, the FWI has shown a high potential for fault detection, delineation and characterization even for crystalline rocks. We are currently applying the FWI on the real data acquired at Soultz-sous-Forêts in 2007. These data show a low S/N ratio as well as some issues concerning the components orientation. All these issues complicate somewhat its application. We are expecting to provide some FWI results from these data before the end of the MEET project.

Figure 1. a) A representative P-wave velocity model used for the sensitivity studies. b) shows the target area around the receivers where the results are presented. The invert triangle are the receivers located in the well and the stars are the source locations on the earth surface. Note that the inter-shot is variable, 500 m around the well head to 1000 m far away the well head. c) shows a screen shot for an experiment of multi-faults modelling provided at time 850 ms. We can observe a complete wavefield including direct and reflected P-waves, S-waves and multiples. We remark the S-wave generated from the faults, the reflected and the converted from the top basement and the multiples in the sedimentary layers (panel c and d), and several other waves. d) the recovered faults for different fault dips and thicknesses (e.g. n°7), and e) shows the estimated faults amplitude at a depth of 2800 m, i.e. 200 m above fault (n°1) crossing the well.


